Report Creation
Report Configuration Building Blocks
Case Central reports are built using Data Sets, which contain fields related to specific system objects - Cases, Activities, Users, and Queues. One or more Data Sets may be used for each report.
In addition to selecting the data fields themselves, other options are available when creating reports. Formatting - including conditional formatting - for the selected fields may be set, as well as the ability to group fields and offer drill down capabilities.
By leveraging these tools, you can easily generate insightful reports to track case progress, analyze workflows, and optimize decision-making.
The Cases Data Set encompasses the largest number of fields, including all data points about the dispute, the consumer, the account, the case status and more. User Defined Fields are automatically available for reporting upon creation and are included within this set. Additional information is available in the remaining Data Sets: Activities, Queues, and Users.
A complete reference list of all available data fields and definitions is provided.
Note
Investigation Checklist fields require configuration before they are available for use in reports. Administrative users can enable these fields through the Checklist Reporting Configuration screen, accessible from the page.
Proper formatting enhances report readability and highlights key data points, making it easier to analyze and interpret information.
To format or conditionally format a report column:
In the Report View, click the
 button and select Design View.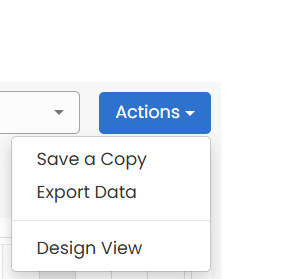
Highlight the field you want to format under Selected Fields.
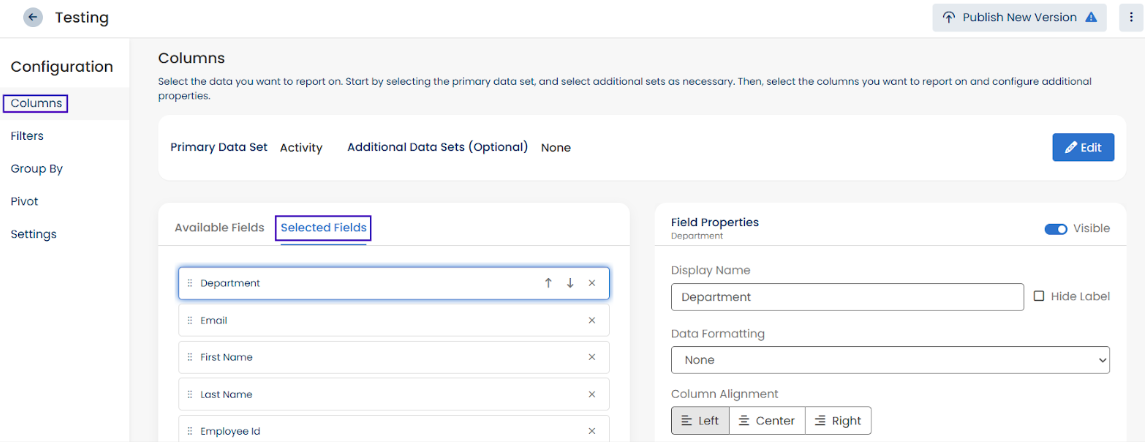
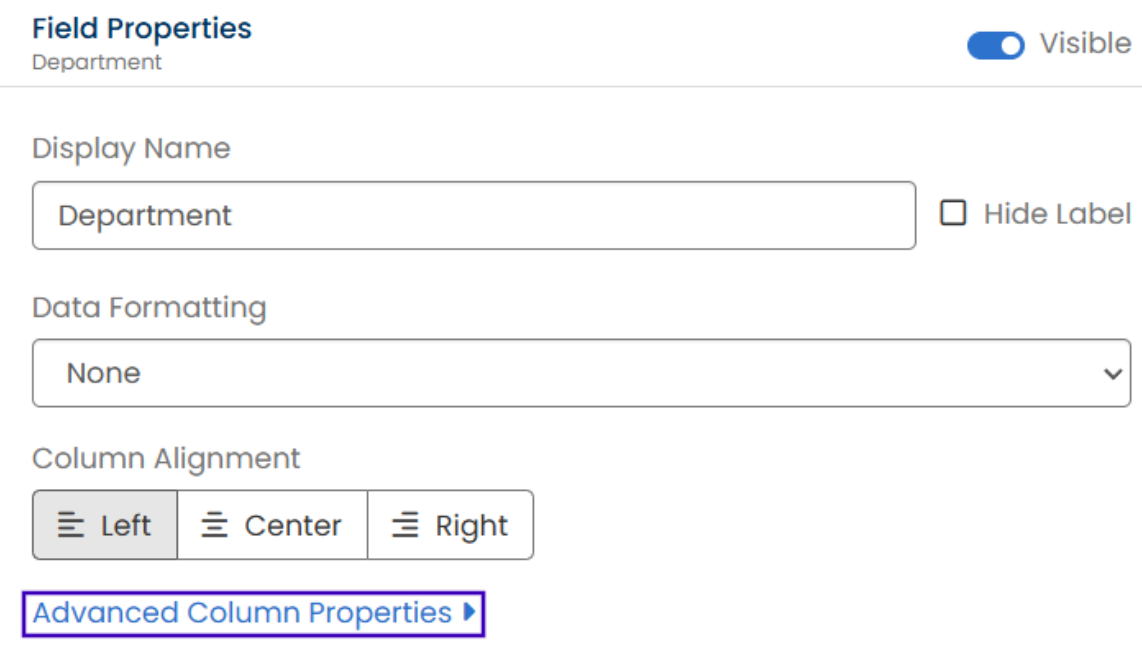
In Field Properties, click on Advanced Column Properties.
Under Filter Type, there are multiple formatting options for Font Color, Background Color, Bold, Italic, and Strikethrough.
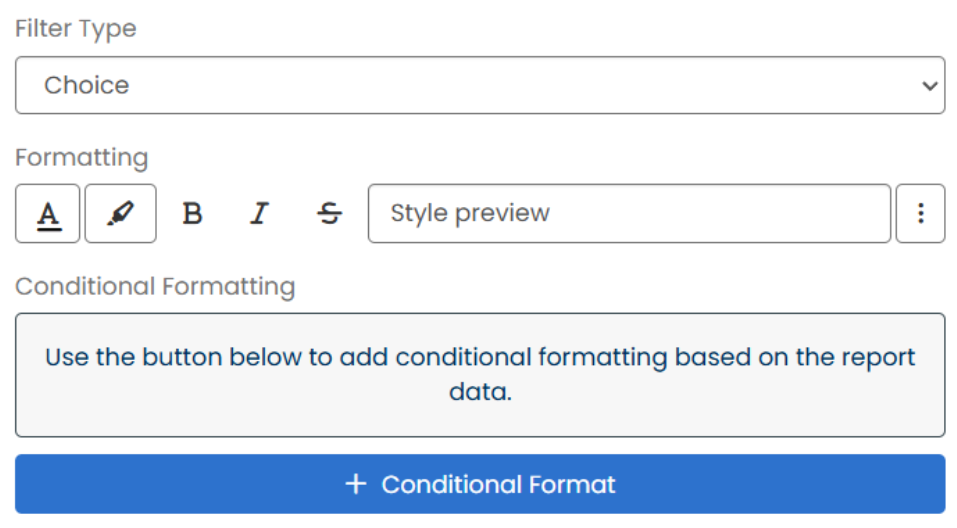
If you want all values in the column to appear the same, select the desired formatting options.
To clear, copy, or paste formatting options, click on the
 menu next to Style Preview.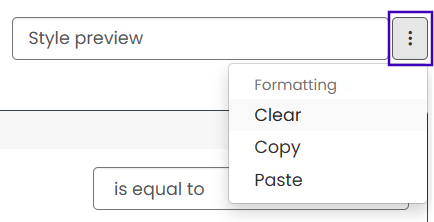
To apply conditional formatting, click on the
 button.
Select the comparison operator for the conditional formatting.
Enter the value that must be met for the conditional formatting and then set the format for those values.
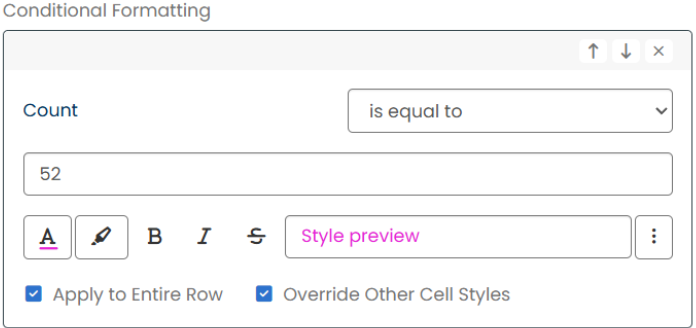
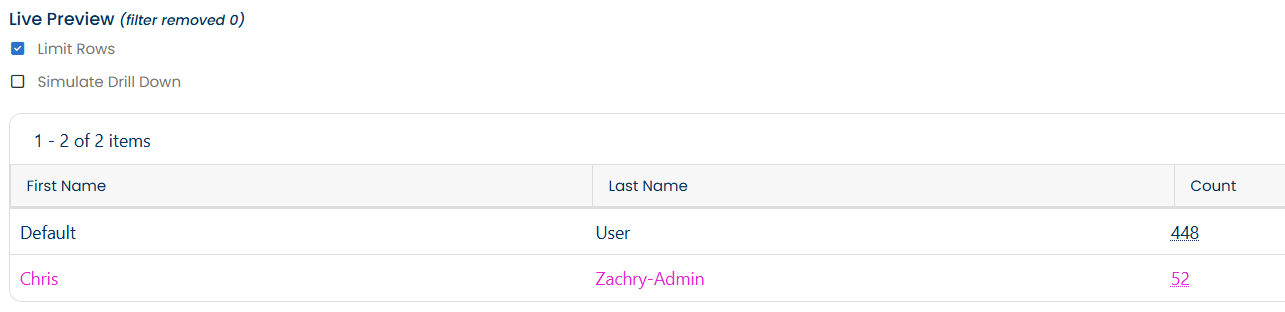
Repeat the process if you want to add multiple conditional formats for a single field. Use the
 icons to change their priority.
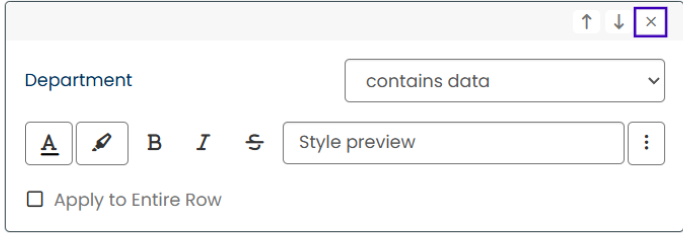
To remove conditional formatting, click the x icon in the conditional formatting box.
Click
 to save your formatting changes.
Note
If you check Apply to Entire Row box, the whole row will follow the formatting applied to the column.
If you check Override Other Cell Styles box, it will apply the formatting even if other fields in the row have styles.
For calculated numeric fields, avoid using is equal to or is not equal to operators as the actual value stored in the system may not match exactly due to rounding.
Grouping allows you to organize report data into meaningful categories for better analysis.
Select Design View from the
dropdown.Click Group By from the menu.
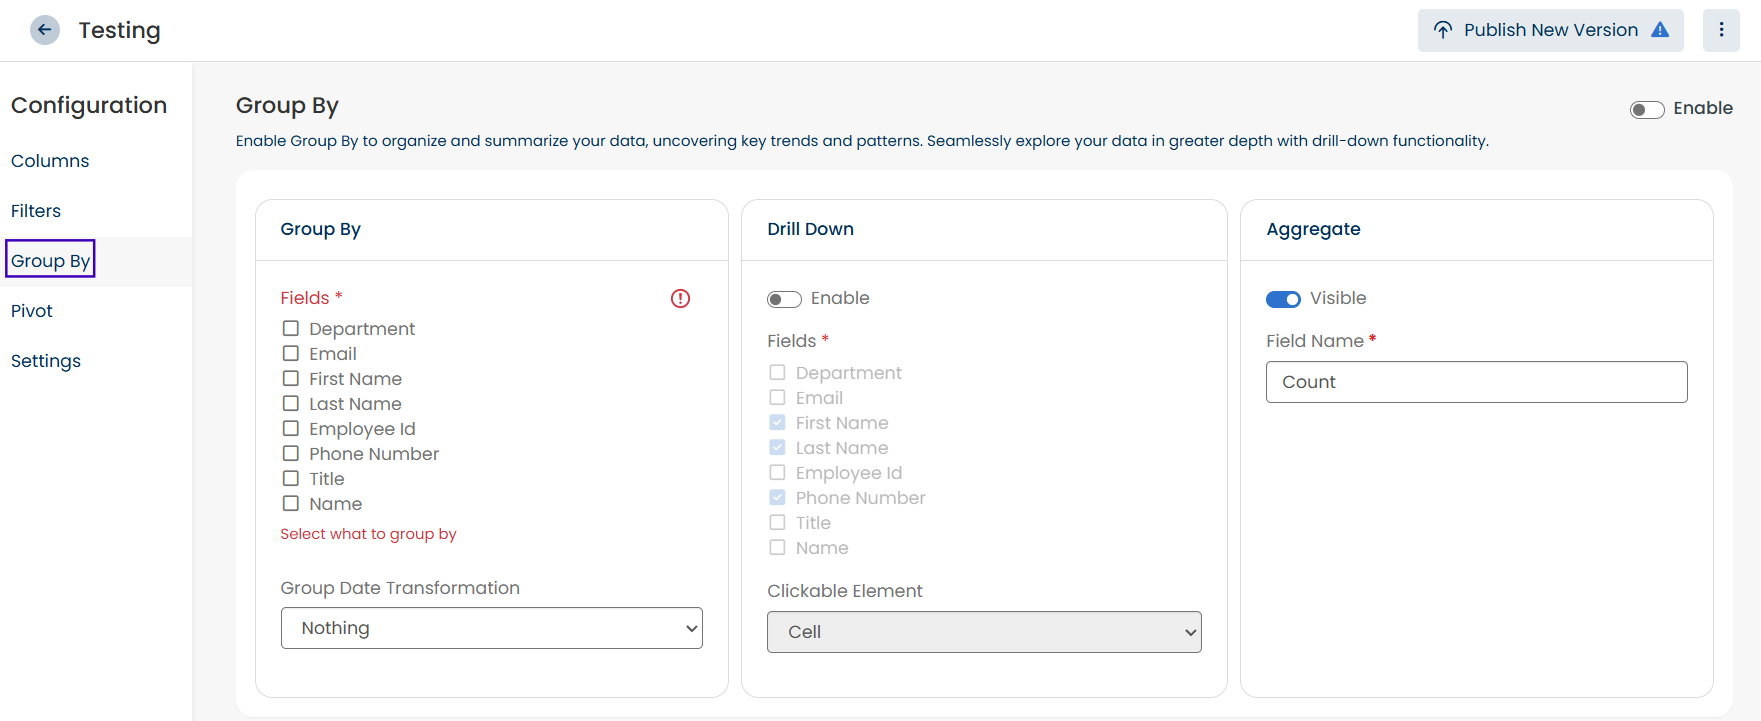
Choose the field(s) you want to group by.
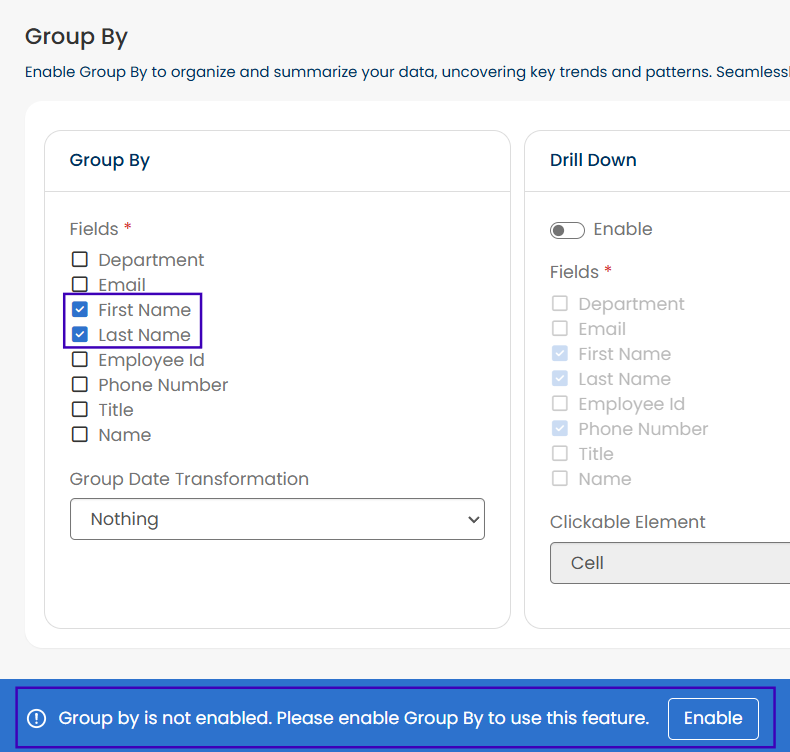
If Group By is not enabled, you will be prompted to enable it.
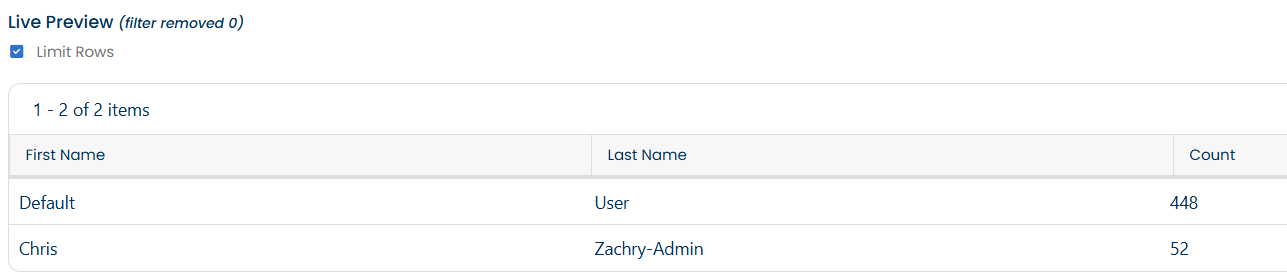
The report preview will adjust to show the grouping. By default, the aggregate field name is called Count.
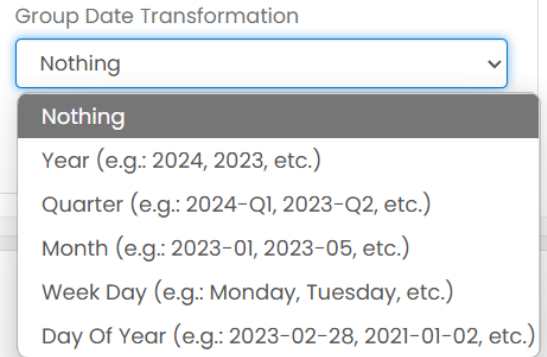
If grouping by a Date field, you can adjust the Group Date Transformation setting to format dates by Year, Quarter, Month, Week Day, or Day of Year.
To hide or rename the Count label, go to the Aggregate section.
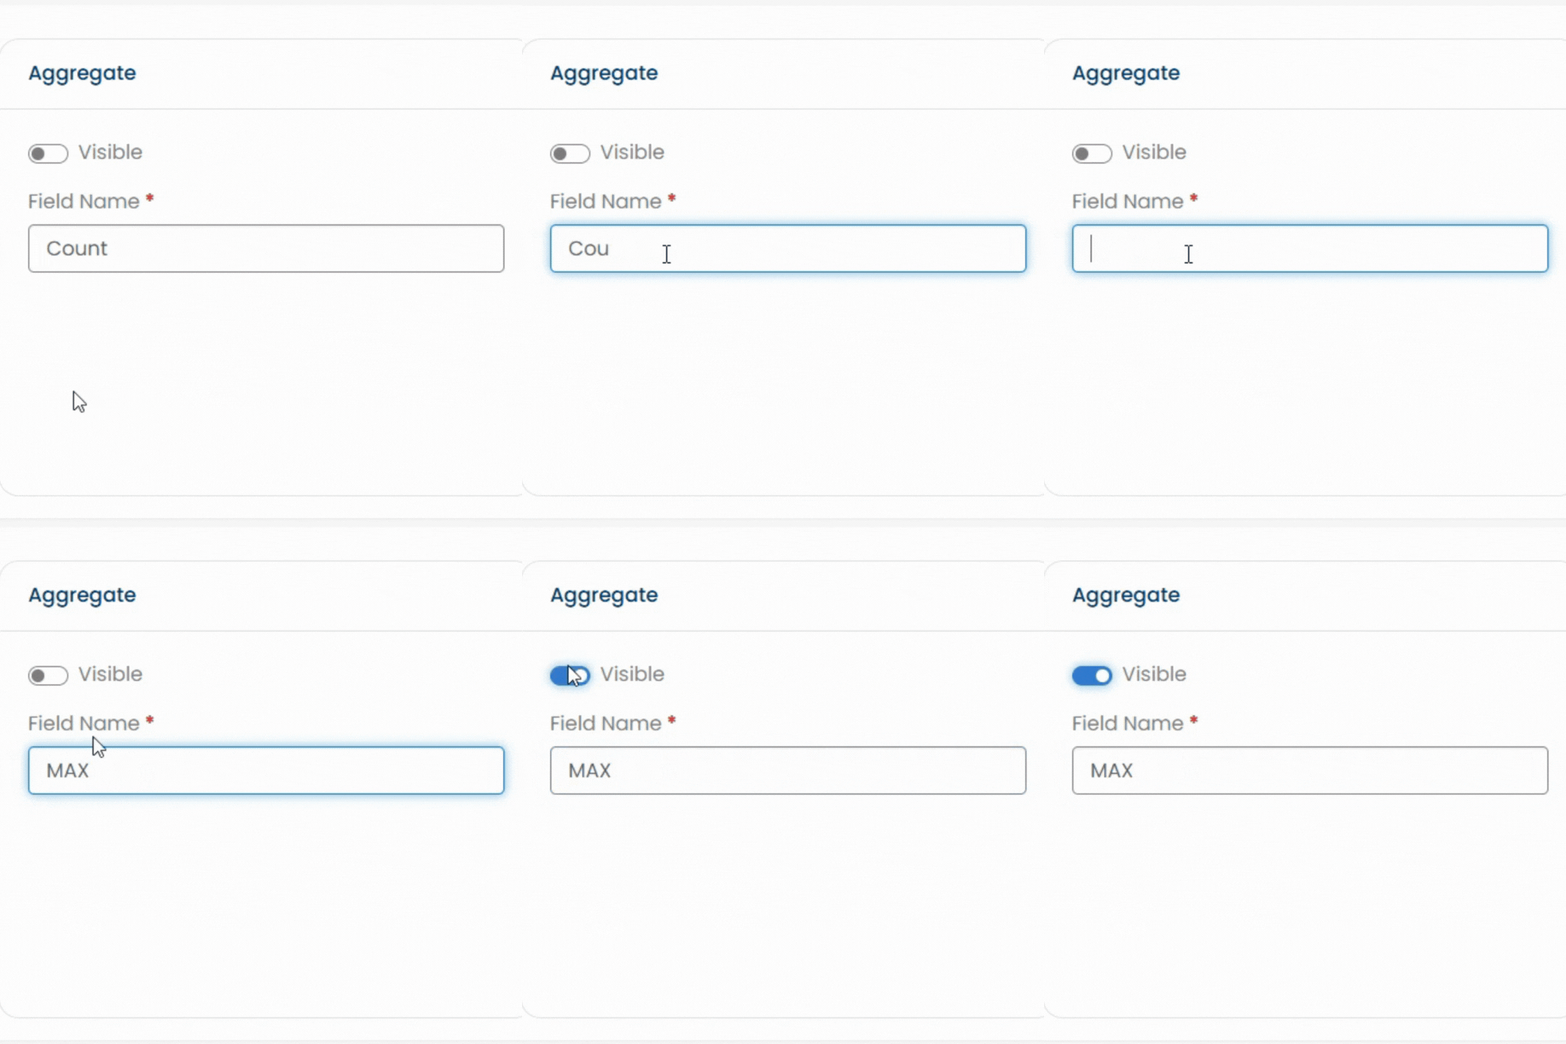
Click Publish New Version to save your settings.
The Drill Down feature allows you to click on summarized report data and view more detailed information, improving data exploration and analysis.
Note
Drill Down only works on reports that have been configured to use data grouping. Before enabling the Data Drill Down feature, ensure that fields have been grouped using the Group By feature.
How to Enable Drill Down:
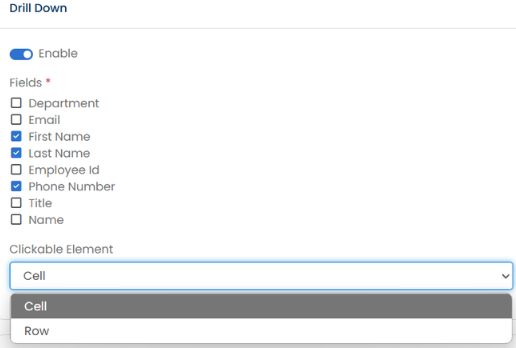
In the Drill Down Settings box, click the
 button to enable Drill Down.
Choose the specific fields to display when users click to view drill-down details.
Designate the clickable element to indicate how users will access drill-down details:
Cell: Clicking on a specific cell opens the detailed view.
Row: Clicking anywhere on a row opens the drill-down details.
Click
to apply updates.
How to View Drill-Down Data:
Once Drill Down is enabled, you can choose where the detailed information appears by selecting an option under the button:
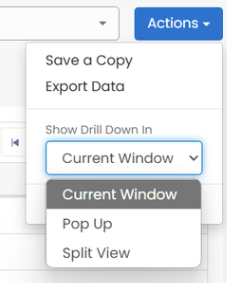
Current Window: Opens the drill-down data in the same window, replacing the summary report view.
Pop-Up: Displays the drill-down data in a separate pop-up window.
Split View: Shows the detailed data below the summary report on the same screen.
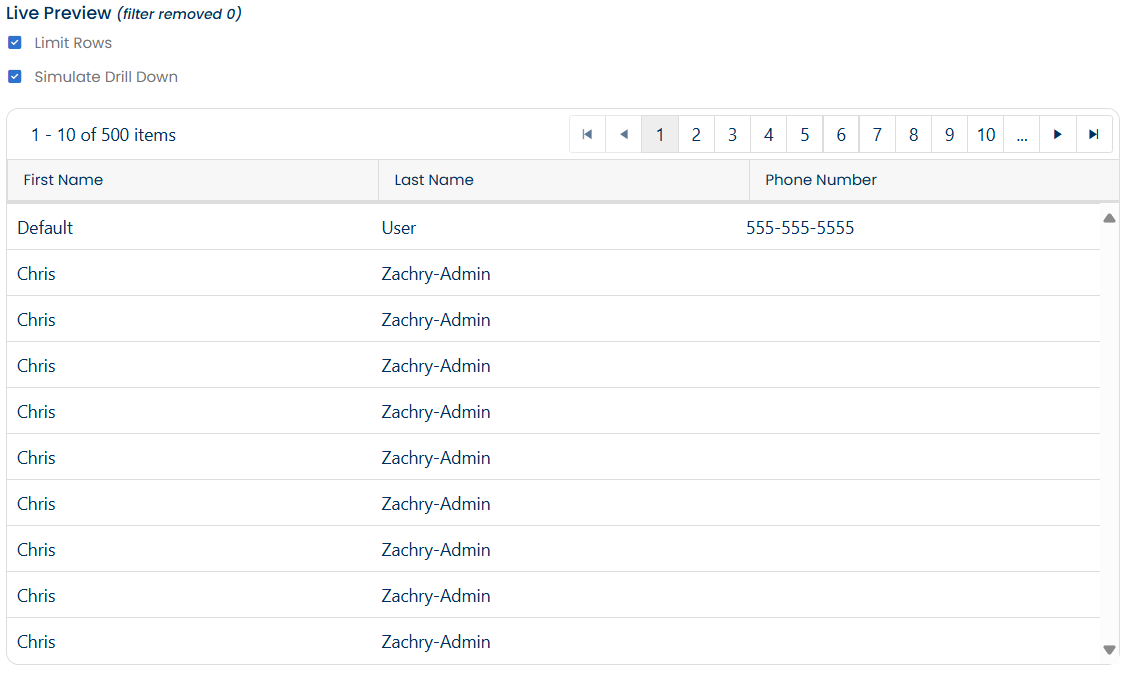
Live Preview & Simulation:
Check the Simulate Drill Down option in the section to test how the drill down will function before publishing.
Note
If you enable Drill Down, but a field is neither included in the Group By section nor selected for the Drill Down view, it will not be visible in the report. A message will appear in the Field Properties panel indicating that the field is not being utilized. You may want to either add it to the Group By or Drill Down settings or remove it from the report.

If a field is not used, consider removing it from the report to keep the data clean and relevant.
Configuration Best Practices
For advanced reporting, you can select a Primary Data Set and, optionally, a Secondary Data Set. Since using multiple Data Sets may result in duplicate records (e.g., multiple rows for the same case, user, queue, or activity), you can use the Filters and Pivot features to ensure meaningful analysis.
When setting up conditional formatting, avoid using is equal to or is not equal to operators for calculated numeric fields because the actual value stored in the system may not match exactly due to rounding.
Example 1. Missed Matches Due to RoundingA rule is created for a calculated numeric field such as a Threshold value, and the comparison value is entered as 605.72. The conditional formatting rule is configured to show the record in green when the value matches 605.72. Although it may appear that your rule isn't working when you see a report value displayed as 605.72, it's likely that the actual value stored is slightly different - perhaps 605.7213. Due to rounding, an apparent match may not be an actual match of values.
Create a Report
Click the
dropdown in the upper right-hand side of the page and select Create Report to open the panel.Enter a Display Name for the new report. The label can contain alphanumeric characters, spaces, or most special characters. Click
 .
.The report configuration screen will open, with the Display Name of the report in the upper left corner.
The left-hand panel has a list of tabs for the configurable components of the report. By default, the Columns tab will be open.
The main portion of the screen is the configuration canvas where the selections for the contents of the report will be made.
A third panel, at the bottom of the screen, displays a Live Preview of the report as it is being built. To maintain performance and ensure quick, dynamic results, a setting to limit the rows contained in the preview is checked by default. Uncheck the
 setting to have the Live Preview bring back all of the data contained in the report as currently configured.
Case Central® groups the reportable fields into Data Sets comprised of related information. Choose the Data Set(s) to be used in the report.
Click on the dropdown field to select the Primary Data Set.
If you would like to include additional data fields, click the relevant toggle switch(es) to the
 position.
Note
Only the Data Sets that can be combined with the selected Primary Data Set will be available for inclusion. Any sets that are incompatible and cannot be presented effectively in a combined report will be grayed out.
Click
 .
.
Configure the report's contents by selecting which data fields should comprise the columns of the report.
Under the Available Fields tab, all of the fields contained in the chosen Data Set(s) will be listed. For easier browsing, the fields are grouped into logical categories, such as Account Information, Dispute Information, and Key Dates. Also, a Text Filter is available to locate the desired fields more quickly if they have already been determined.
Add a field by clicking the
 icon next to the field name to move the toggle switch to the right position. The order of selection is not important, as the columns can be easily reordered in the next step.
Once the appropriate fields have been selected as columns in the report, go the the Selected Fields tab at the top of the column selection panel. Here you will configure the report's display options.
Reorder the fields as needed by moving them up or down using drag-and-drop or the
 arrows that are visible once a listed field has been clicked on.
Clicking on a field in the Selected Fields list will also populate the panel on the right. Configure the display attributes for each field.
By default, the field will be a displayed column in the report. To hide the field, click the
icon next to Visible in Report to move the toggle switch to the left position.The Display Name can be edited or even hidden if desired. Changing the name does not impact the field's name elsewhere in the system, but only serves to update the column name in this report.
To change the Formatting of the field value, select the appropriate data format from the dropdown list.
Choose the Column Alignment you want applied to the field.
Once all of the columns have been added and configured, the report is ready to be viewed or published. Additionally, more advanced configuration options are available to filter or pivot the data in the report.
Note
There is no need to save the report explicity because the system auto-saves the user's selections and entries while building the report.
To view the report, click the
 icon and select View Report. Alternatively, you can click the left arrow next to the report's name in the upper left-hand corner of the screen to go back to the main page. Click on the name of the report you want to view to open it.